Maintenance Efficiency
Ref: AG3_206
Description
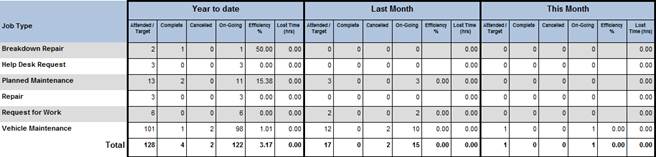
This report returns a matrix report separated into 3 areas. It displays an efficiency assessment figure represented as a percentage based upon work order due date for the current month, the previous month and the year to date for each job type that has been used in the selected period.
The report returns;
Job type (Job type description)
For each table, year to date, last month, current month;
Attended / Target
Complete
Cancelled
On-Going
Efficiency %
Lost Time (total from work orders in hours)
Operational Criteria
The report returns a grouped summary comprising of totals calculated from all work orders that meet the selected filter criteria.
Work order selection
• Job type
• Craft
• Date for report
o This date forms the basis for the report and is used for current month. The last month and year to date are then relational to this date. This date is compared to the work order due date. Any work orders with a due date greater than this date will be excluded from the report.
Equipment Selection
• Equipment Filter
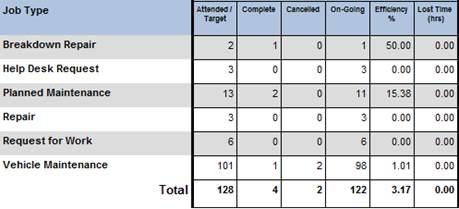
The values within the report are calculated in the following way;
Attended / Target Count of work orders raised
Complete Count of work orders completed
Cancelled Count of work orders cancelled
On-going Attended – Complete – Cancelled
Efficiency Complete / (Attended – Cancelled) expressed as a percentage
Lost Time Sum of lost time from all labour transactions from work orders
Aims
The report is designed to provide an assessment of how efficient operations and how the current month is performing in comparison to the last month.
The year to date provides an overall assessment figure.
For example;
If we are interested in breakdown jobs;
If the current month is 20%, the last month was 10% and the year to date figure is 40%. It can then be stated that there has been a 10% increase in efficiency over the last month when dealing with breakdown jobs and as of at this date we are 40% efficient at dealing with breakdown jobs.
Results Analysis
The ideal here is to see a consistent or increasing efficiency figure between last and current month and again a consistent or increasing figure on year to date.
It also highlights potential efficiency problems between job types, looking at the sample figures below breakdown repairs are being dealt with at around 50% efficiency but planned work is only 15.36% and the cause of why this efficiency figure is so low should be looked into.