Downtime Analysis
Description
This report provides an analytical breakdown of offline time for break down type completed work orders. The report can be ordered and grouped in a variety of predetermined ways.
The report returns;
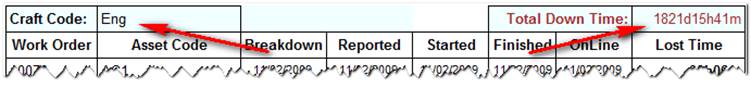
Craft Code
Work Order Number
Asset Code (Equipment code)
Breakdown (Break down date from work order)
Reported (Break down reported date from work order)
Started (Repair started date from work order)
Finished (Repair completed date from work order)
Online (Online date from the work order)
Lost time (Calculated)
Totals for the following are also returned, the order depends on what the totals are returned against.
Between Break and Report
Between report and Start
Between Start and Finish
Between Finish and Online
Total overall downtime for selected group; In the above example the report is ordered by craft so the total downtime for that craft is displayed.
Operational Criteria
The report will return all the work order records that meet the specified filter criteria the sort them into the selected order. Following the sort totals will then be calculated.
• Work Order creation date range (labelled start date / end date)
o This will include any work orders that have been raised where the work orders created date is within the specified date range
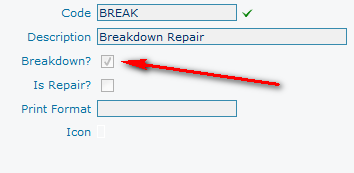
• Job Type (Leave null for all relevant job types, see below)
o Only job types where the job type has been marked as a breakdown type job in the work order type definition, within standing data. (Please refer to job types for more information). Will be available for selection.
(Standing data >> work orders >> work order type codes)
Order by
This selection list allows the report to be ordered and grouped in one of the predetermined sort orders.
Site
Asset
Craft
Asset group
Equipment Type
Site and Asset
Site and Craft
Site and Asset group
Site and Equipment Type
Calculations;
Each of the totals is calculated based upon the work order results for the selected group (order type).
Between break and report
Sum (reported date time – breakdown date time)
Between report and start
Sum (repair started date time – reported date time)
Between start and finish
Sum (repair completed date time – repair started date time)
Between finish and online
Sum (online date time – repair completed date time)
All date and time values are taken from the work order.
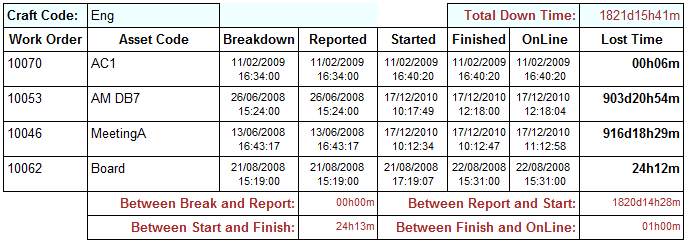
In the following screen capture example the report has been ordered by Craft code.
Taking the ‘Between start and finish’ total for this example the way in which this is worked out is as follows;
The time difference between the repair started date/time and the repair completed date time on the work order is calculated.
Then the time difference for each work order in this group, where the craft code is ‘ACeng’, is added together to give an overall total.
The time difference for the other ‘between’ totals is calculated in the same way using the appropriate date/time values form the work order.
Work order lost time is calculated as;
Online date time – breakdown date time
Total down time is the sum of ‘lost time’ for each work order in the group.
Aims
The report aims to provide the user with an analysis of lost time due to break downs. With an ability to perform analysis on a variety of different levels, i.e. for example if ordered by equipment type it could be possible to see how much time had been lost in the last month repairing IT equipment.
Results Analysis
By identifying specific areas where the highest amount of lost time exists should enable targeting and scheduling resources more efficiently.
A report ordered by craft can indicate a lack of resource in a particular skill base (craft).
The report should also be examined for reoccurring equipment items or items which are contributing a high value of lost time. The cause of these should be examined by further analysis of the work orders.
Looking at where the time has been lost is equally as important.
Looking at this first example screen capture the total lost time is 24h and 12m.

The total time attending and starting repairs after they were reported was only 2 hours, but the total time spent doing repairs was 22 hours and 12 minutes, so approximately 92% of the lost time was spent doing repairs.
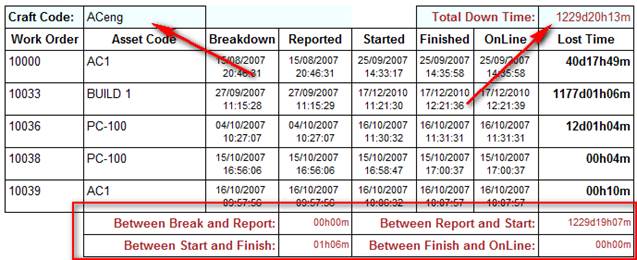
However in the following screen capture example;

Only 1 hour was spent performing the repairs but 4 hours and 6 minutes were lost from the job being reported to the job being started. So of the overall lost time of 5 hours and 6 minutes approximately 80% of the lost time was in attending the job.