Pareto Analysis
Ref: AG3_002
Description
This report provides a graphical representation or tabular listing of equipment showing amount of maintenance resource used by each item.
This is done by analysis of work orders within a given date range. The basis for analysis can be selected by the user at runtime and includes options for different aspects of time and cost analysis.

Operational Criteria
For both chart and list reports results are returned based upon work order records meeting the selectable filter criteria;
Pareto
Basis of analysis
This is where the user selects what is to be used as the basis for calculating resource usage; each is calculated against individual equipment items.
|
Selection |
Description |
|
Labour Hours |
Work time plus travel time (if applicable) |
|
Labour Cost |
Labour Hours (as above) multiplied by the rate for the time period |
|
Material Cost |
Overall cost of inventory items issued to work orders plus any other associated material costs. |
|
Down Time |
Total of down time recorded or calculated on work orders |
|
Total Cost |
Labour cost (as above) plus the material cost |
|
Number of jobs |
Total number of work orders raised |
• Work Order start date range
o This will include any work orders that have been raised against the equipment item where the work orders start date is within the specified date range
• Percentage of items / Number of items
o This represents the number of items to be returned that meet the filter criteria. The items selected are based upon the ‘top’ matches meeting the selected analysis method and criteria.
• Equipment filter
So for example;
if you wanted to examine the ten highest maintenance cost items, between 01/01/2018 and 01/01/2019 based upon the overall labour cost of work order orders raised against the equipment;
The Pareto filter would be set as follows;
Basis of Analysis Labour Cost
Start date => 01/01/2018
Start Date <= 01/01/2019
Percentage of items 0
Number of items 10
Equipment filter Default settings
Aims
This report is designed to help to reduce maintenance costs and down time.
The report aims to provide the end user with an analysis of equipment items that are using the highest volume of maintenance resources; time, material etc. based upon the selected analysis method.
From these results further targeted analysis of specific equipment can be made with a view to reducing maintenance costs by perhaps application of additional or revised planned preventative maintenance schedules, use of harder wearing components or even equipment replacement.
Results Analysis
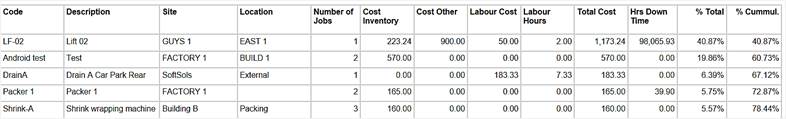
Pareto List
Depending on the analysis method selected the grid initially opens sorted showing the items which have used the highest quantity of the selected resource first.
Items where the percentage total is high are the items using the most resource. The causes of the high resource usage should be investigated further.
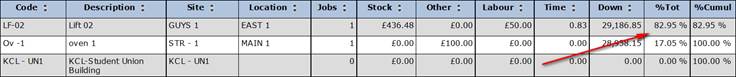
The cumulative percentage (%Cummul) shows a running total of the percentage totals. Once this value reaches 100% there are no more items within the current sort where resource has been used.
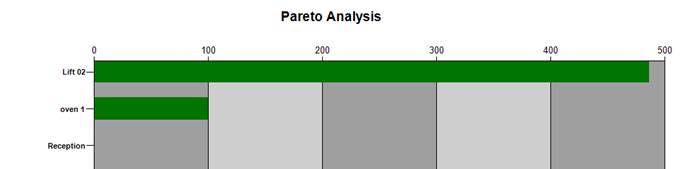
Pareto Chart
The chart displays equipment items on the y axis and the selected analysis method on the x axis.
The screen capture below shows ‘labour cost’. Again the items displaying the highest values are those using the most resources and causes should be looked into.