Key Performance Indicators (KPIs)
A user of the system can select to have several Key Performance Indicators (KPIs) placed on their main menu screen (if the menu set they are using has been configured to reveal the display area, if not they will be hidden). These KPIs are driven from data supplied by a Business Object and the user can define the format of the graphical display, its location and size on their screen.
Accessed from System Configuration >> Charts & Reports >> Chart Registry
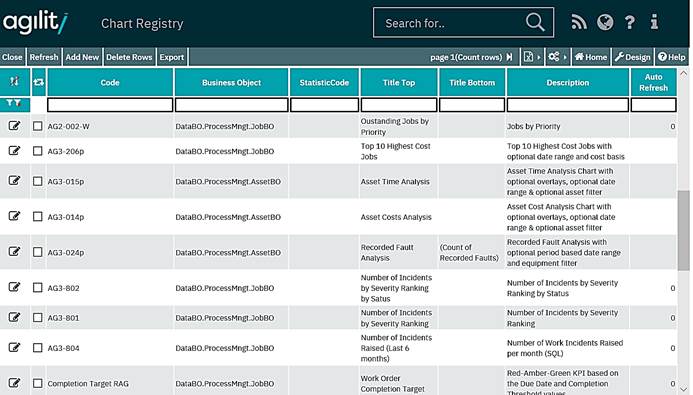
Click on Add New to create a new KPI:
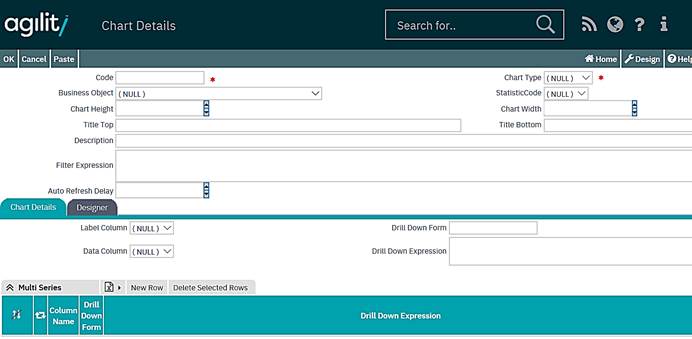
KPI Details
Header fields;
|
Field |
Mandatory |
Description | |
|
Code |
Yes |
The unique code of the KPI being defined – free text. | |
|
Chart Type |
Yes |
The type of the KPI chart being defined. Standard – the data for the statistic is retrieved from the function published by the Business Object, SQL – the data for the statistic is retrieved by executing the SQL statement defined within the KPI on the SQL Details Tab | |
|
Business Object Name |
Yes |
For Standard chart type it represents the name of the Business Object supplying the data for the Chart, for SQL chart type it specifies the business object, which will be taken as a source of the security rules added to the SQL statement before it’s executed . | |
|
Statistics Code |
Yes |
The name of the data source for the Chart from within the Business object. Once a Business object is selected this drop down field will be populated. This is relevant only for Standard type of the KPI. | |
|
Chart Height |
Yes |
The height of the Chart, in pixels, as it will appear on the users menu. | |
|
Chart Width |
Yes |
The width of the Chart, in pixels, as it will appear on the users menu. | |
|
Title Top |
No |
Text to appear on the top of the Chart. | |
|
Title Bottom |
No |
Text to appear on the bottom of the Chart. | |
|
Description |
No |
A description of the Chart. This does not display alongside the Chart. | |
|
Filter Expression |
No |
An optional Filter Expression. This SQL like expression controls which records are included in the KPI. How the records which are included are analysed is predefined within the KPI and cannot be changed by the user. See the section on “Filter Expressions” for details of the syntax. This field is relevant only for Standard type of the KPI. | |
|
Auto-refresh delay |
No |
The number of seconds after which the Chart will refresh automatically. Auto-refresh function will be disabled if this value is not populated or set to 0. | |
Chart Details Tab
The information in the Chart Details tab allow to define the additional details of the KPI like data source column names displayed as labels and details of the drill-down function.
|
Field |
Mandatory |
Description |
|
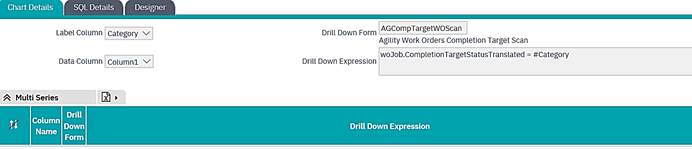
Label Column |
No |
The name of the data source column used for data point labels. First column form the data source will be used if this field is left as null. |
|
Data Column |
No |
The name of the data source column to be used as value for data points. Second column of the data source will be used if this field is left as null. |
|
Drill Down Form |
No |
The name of the form used as a drill-down form when a particular data segment is clicked on the chart. The drill-down functionality will be disabled if this field is left as blank. |
|
Drill Down Expression |
No |
Filter expression passed to the Drill-down form when the particular data segment is clicked on the chart. Data values can be included by using a # (hash) sign appended by the data column name. |
|
Multi Series |
No |
This grid has been provided to allow definition of multiple data series within a single KPI. 3 fields Column Name, Drill Down Form and Drill Down expression can be specified for each data series. |
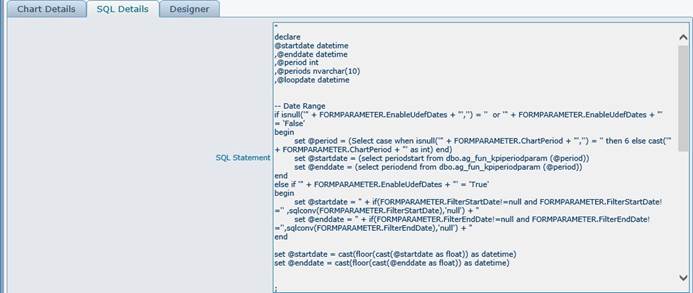
SQL Details tab
This tab is only visible when SQL Chart Type has been selected in the KPI header. The contents of the field should be a valid string expression, which evaluates to the valid SQL statement. The example contents of the SQL Details field are shown on the screenshot below.
The Colour List field can be populated with the comma-separated list of valid colour names if the chart should have predefined colours for its data segments.
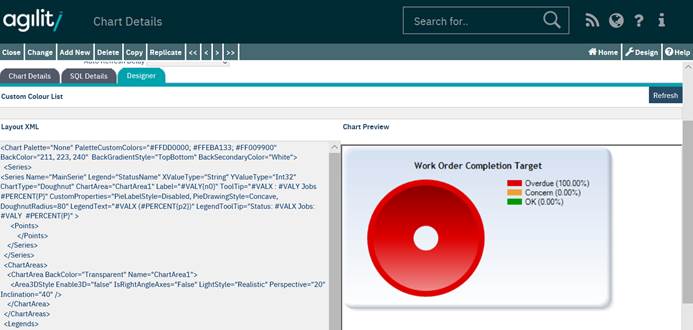
Designer tab
The designer tab allows you to specify the details of the graphical layout of the Chart in the form of a well formatted xml file. The Chart Preview area shows the Chart image according to the current settings for the data source, drill down definition and the layout defined. The syntax and possible options within the Layout XML field should only be altered by advanced users after appropriate training, and the details are out of the scope of this help document.