Equipment MTBF
Ref: AG3_008
Description
This is the mean time before failure report which is designed to show the average time between breakdowns, attendance to breakdowns and repair time.
This is done using 3 charts, displaying the summary element on the x-axis and averaged time on the y-axis.
The summary element is the amount of detail you want to show; asset, grouped by sub-location, grouped by location or grouped by site with asset being the highest detail level.
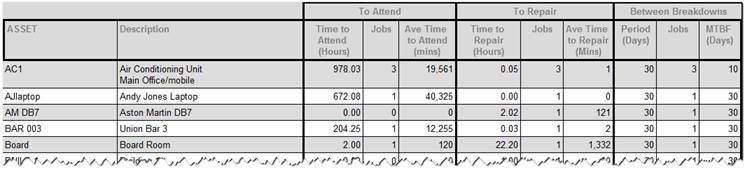
The final page shows the actual and average figures used in the calculations in a tabular listing.
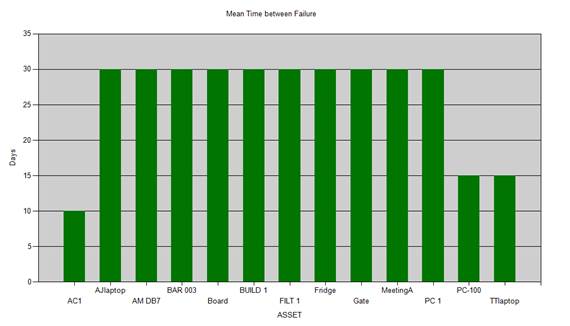
Mean time between failures
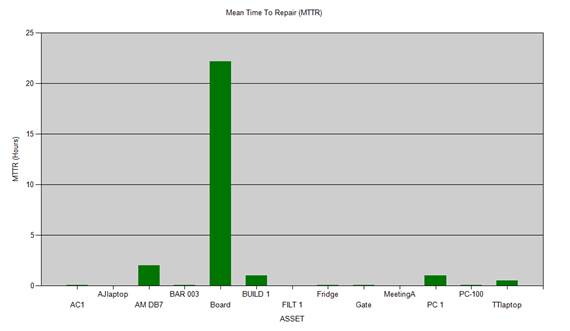
Mean time to repair
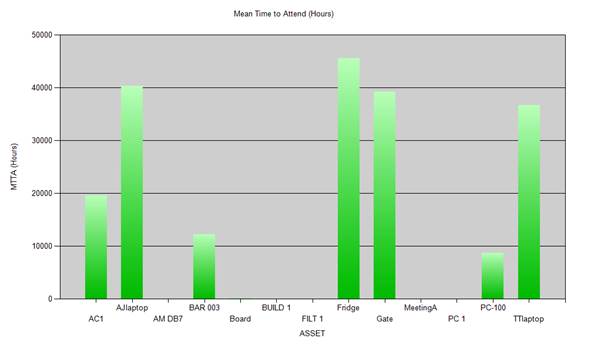
Mean time to attend
Operational Criteria
Results are calculated and returned based upon selected filter criteria and operational parameters.
• Work order start date range
o This will only include any work orders in the cost and time calculations that have been raised against the equipment item where the work orders start date is within the specified date range.
• Exclude Jobs > Mins
o This will exclude any jobs that took longer than the specified time in minutes. This is to allow for circumstances where an item of equipment is offline for lengthy periods of time, for example if awaiting parts. Incorporating such figures into the calculations would produce an unrealistic analysis. The time period can be specified according to requirements.
• Exclude Response > Mins
o This will exclude any jobs where the time taken to attend was greater than the time specified in minutes. As above even odd instances where the time taken to attend was unusually large compared to the normal could result in unrealistic analysis.
Job exclusion example;
If we look at 5 jobs, where the part replaced and procedure was the same and time taken to repair in minutes was 10, 12, 14 and 9 on the first four and then due to awaiting parts the fifth job took 150 minutes then the average across these is 40m12s but looking at the times involved when parts are available the job only takes on average 11m25s.
• Summary Level
o This determines to what degree the charts should be broken down;
§ Sites
§ Locations
§ Sub-Locations
§ Individual Equipment
• Equipment Filter
Calculation Methods
Mean Time between Failures
Number of days in the period defined by the filter / Number of breakdown jobs meeting filter criteria
Mean Time to Attend
Sum (Repair started time – Breakdown reported time) / Number of breakdown jobs meeting filter criteria*
(*Total of the time difference between the breakdown being reported and the repair started / Number of jobs)
Any jobs where the time to attend exceeds the specified ‘Exclude Response > Mins’ value are excluded from the calculation.
Mean Time to Repair
Sum (Repair completed time – Repair started time) / Number of breakdown jobs meeting filter criteria*
(*Total of the time difference between the repair being started and the repair being completed / Number of jobs)
Any jobs where the repair time exceeds the specified ‘Exclude Jobs > Mins’ value are excluded from the calculation.
The calculated values are also displayed in the tabular listing.
Aims
The report aims to highlight weaknesses within the operation process model by identifying frequently failing equipment or breakdowns resulting in large amounts of down time.
Results Analysis
Items showing a low number of days on the ‘mean time between failures charts’ do indicate frequent breakdowns.
Ones where the number of days between breakdowns is higher do suggest higher reliability.
Using this in conjunction with the ‘time to attend’ and ‘time to repair’ charts identifies problems within the process for which the causes can then be investigated.
Taking as a quick example from the charts shown earlier in this section;
It can be seen from the MTBF chart that the item ‘AC1’ breaks down quite regularly, on average every ten days. However looking at this item on the ‘time to repair’ chart shows that it does not on average take long to repair and likewise using the ‘time to attend chart’ it can be seen that it doesn’t take long to get to the job.
So although it is viewed unreliable, the resultant downtime time is not comparatively significant compared to other items. In this scenario the reasons for the unreliability should be investigated and addressed.
Again looking at the MTBF chart it can be seen that the item ‘board’ is more reliable than ‘AC1’, but looking at the other charts shows that the time taken to attend the job is on average much less than for ‘AC1’ but the time taken to repair the equipment is significantly greater than ‘AC1’.
From this analysis the downtime of the item ‘board’ is greater than that of ‘AC1’. In this scenario the repair process and method should be investigated with a view to reducing repair time.