Standard Job review
Ref: AG3_101
Description
This is a listing of standard jobs returned as a grouped tabular listing of costs incurred on completed jobs generated from standard jobs.
The report is broken down into individual work order detail showing costings for each work order with totals.
The report is passed 2 operational parameters, which are used as percentage variances from standard to highlight individual work orders that are outside of acceptable tolerance.
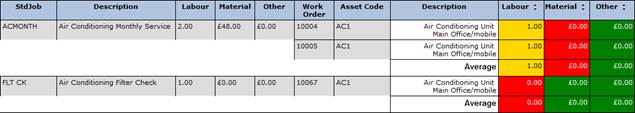
The totals columns on the report are then colour coded according to whether they meet tolerance or exceed it. By default green is used for acceptable the lower variance (Amber) and the higher variance (Red) but these colours can be changed dependant on selected report theme.
The report returns;
Standard job code
Standard Job Description
Labour Hours (As defined the job, i.e this job should take 1 hour)
Material Costs (As defined for the job, i.e. this job should cost £25.00 in materials)
Material Costs (As defined for the job)
Work Order Number
Equipment Item Code
Equipment Description
Actual labour cost
Actual material cost
Actual other costs
Operational Criteria
Results are returned based upon filter criteria and operational parameters which conditionally control the background colour of the actual costs cells.
• Work order completion date range
o This will only include any work orders in the cost and time calculations that have been raised against the equipment item where the work orders completion date is within the specified date range.
• Amber Percentage (Over or Under)
o This figure represents the +/- percentage tolerance allowed for the actual material and time costs. If the figures exceed tolerance by this figure then the colour will change to whichever colour is designated as ‘amber’ by the current report theme. For example if the tolerance is set to 20% and if the planned material costs should be 10.00, then if the actual cost was between 8.00 and 12.00 then the cell colour will be ‘green’ but if it is less than 8.00 or greater than 12.00 and inside of the red percentage tolerance it will be displayed as the ‘amber’ colour.
• Red Percentage (Over or Under)
o This figure represents the +/- percentage tolerance allowed for the actual material and time costs. If the figures exceed tolerance by this figure then the colour will change to whichever colour is designated as ‘red’ by the current report theme. For example if the tolerance is set to 50 and the planned material costs should be 10.00, then if the actual material costs were less than 5 or greater than 15 then the cell colour would be displayed as whatever is defined as the red colour in the report theme.
Further cost tolerance example;
Based on planned material costs being 10.00, amber tolerance set as 20% and red tolerance set as 50 %
|
Actual Cost |
Cell condition |
|
Between 8.00 and 12.00 |
Green |
|
>5.00 and <8.00 to >12.00 and <15.00 |
Amber |
|
<5.00 and >15.00 |
Red |
• Standard Job Filter
Aims
The report aims to provide an overview of planned works highlighting where PPM costs exceed planned expectations.
Results Analysis
By examining where costs do exceed expected values frequently on the same job it should be investigated why this is and may result in a requirement to increase or decrease the planned values on the job.