Pareto Tab
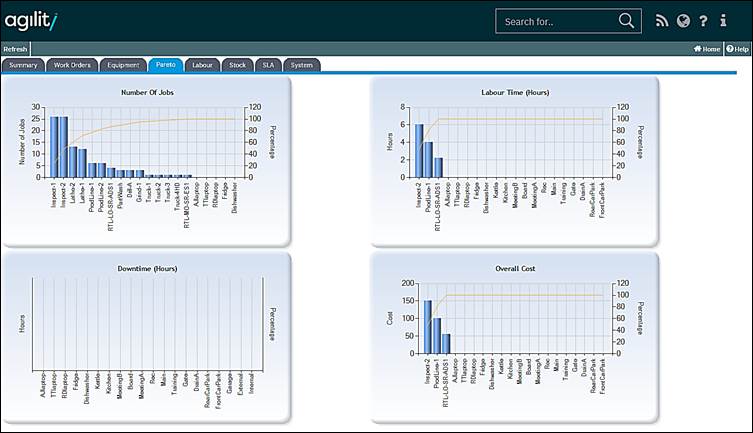
This tab plots the Pareto Analysis (80/20 rule) across four different charts displaying:
• Number of Jobs
• Labour Time in hours
• Downtime in hours
• Overall Cost

This tab plots the Pareto Analysis (80/20 rule) across four different charts displaying:
• Number of Jobs
• Labour Time in hours
• Downtime in hours
• Overall Cost
