The Agility User Environment
Once a user has successfully logged into the Agility system, the main screen is displayed within the Internet Browser session.
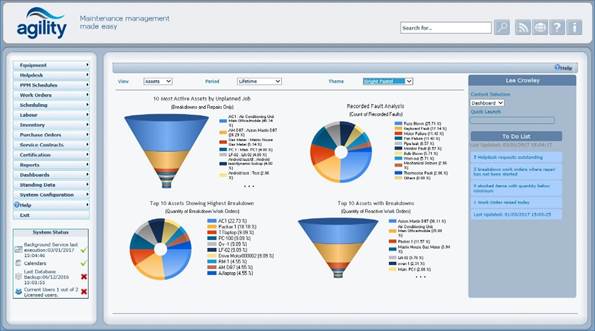
This is the standard “out of the box” Agility environment, although this can be customised by the system administrator.
The area across the top of the screen contains the “Global Search Field” (where the “Search for…” text is displayed). As the name suggests, this is a far reaching search tool and can be extremely useful for someone unfamiliar with the data contained in the system; or indeed, anyone wanting to search globally within Agility.
The buttons to the right of this Global Search field are, in order:
•  This will run the Global Search, based
on the values typed in.
This will run the Global Search, based
on the values typed in.
•
 This is the RSS feed button
(Rich Site Summary; originally RDF Site Summary; often called
Really Simple Syndication) uses a family of standard web feed formats to publish
frequently updated information: blog entries, news headlines, audio, video. This
can be configured to display information relevant to you and/or your
industry.
This is the RSS feed button
(Rich Site Summary; originally RDF Site Summary; often called
Really Simple Syndication) uses a family of standard web feed formats to publish
frequently updated information: blog entries, news headlines, audio, video. This
can be configured to display information relevant to you and/or your
industry.
•  Another configurable button, this time to
access your Intranet site.
Another configurable button, this time to
access your Intranet site.
•  The “Help” icon, which will take you into this
very information.
The “Help” icon, which will take you into this
very information.
•  The “Information” icon, this will display
important Agility system information such as:
The “Information” icon, this will display
important Agility system information such as:
o The specific Agility version and Service Pack details
o The names and location of the databases.
The menu is displayed in the left hand pane of the main window.
The System Status monitor is displayed at the bottom left of the screen, underneath the menu (although again, whether this displays for a user is controlled by the System Administrator). It is used to indicate:
• Whether the “Background Process” is currently running. This will be discussed later in relation to PPM Schedules.
• Whether the system Calendar is up to date.
• The last time the Agility databases were backed up.
• The number of current users logged onto the system, and the maximum number of concurrent users allowed.
The Agility Dashboard occupies the rest of the screen area. It contains Charts and Key Performance Indicators (KPIs) for the majority of the screen area. These are used to report on system statistics such as work allocation or number of outstanding work orders. These can be used on a Manager’s screen to help quickly identify performance. The “drop-downs” at the top of the form allow these to be amended to:
• Display different timescales for the data.
• Display different data entirely e.g. Jobs, Metrics.
• Change the colour scheme of the charts.
To the right of these charts is the “To Do” list. This contains a “drop-down” to allow the user to switch from displaying the default charts, to utilising a “Site Map” (if this has been set up) and a list of (configurable) relevant information such as:
• The number of Outstanding i.e. not yet processed Helpdesk Requests.
• Inventory items where stock values have dropped below specified minimums.
• The amount of Work Orders raised so far today
The user’s level of access to the system determines the menu options and KPIs available. User permissions are discussed later in this document.